Hurricane Spaghetti Models: Unraveling the Chaos Through Tangled Forecast Trails
Hurricane Spaghetti Models: Unraveling the Chaos Through Tangled Forecast Trails
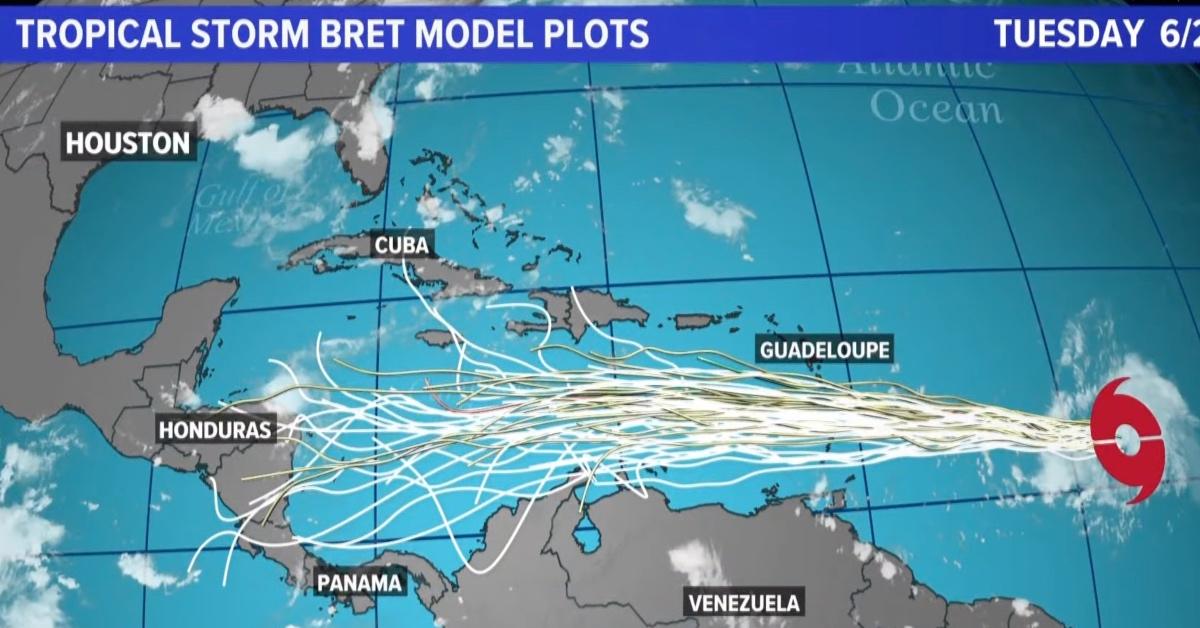
When hurricanes threaten coastal regions, meteorologists rely on tools that transform uncertainty into actionable maps—none more iconic than the spaghetti model. These convoluted yet indispensable visualizations chart hundreds of possible storm tracks by simulating multiple computational forecasts, each reflecting different assumptions about atmospheric conditions, ocean temperatures, and wind patterns. Far from a simple line announced by the National Hurricane Center, the spaghetti model reveals a spiderweb of potential paths, capturing the inherent unpredictability of tropical systems as they evolve across dynamic environments.
The spaghetti model emerged from an era when computer forecasting began to outpace human intuition. By aggregating dozens—sometimes hundreds—of individual storm simulations run on varying initial conditions, meteorologists generate a dense collection of projected tracks. Each line represents a unique forecast from specialized models like the European Centre for Medium-Range Weather Forecasts (ECMWF), the Global Forecast System (GFS), or the Hurricane Weather Research and Forecasting (HWRF) model.
These calls are not random; they account for subtle differences in initial data, model physics, and environmental factors, producing a “web” of likely outcomes.
At the core of the spaghetti model lies computational forecasting, a process driven by complex numerical simulations. Using supercomputers, meteorological centers ingest real-time atmospheric observations—temperature, pressure, wind speeds, humidity—and plug them into fluid dynamics equations solving for the atmosphere’s behavior.
Each simulation treats the storm as a point mass responding to a shifting map of high and low pressure, sea surface warmth, upper-level winds, and moisture availability. As a hurricane moves westward across the Atlantic, each model refines its projections in 6- to 48-hour increments, generating a line that wiggles unpredictably, sometimes clustering narrowly, other times diverging widely.
What appears chaotic at first glance—hundreds of overlapping lines—carries profound insight. The tight grouping of forecast tracks signals confidence, often indicating consistent steering flow dominated by a strong ridge of high pressure.
Conversely, a widely scattered cluster reflects higher uncertainty, where storm movement could swing dramatically based on evolving interactions with upper-level steering currents.
The Layers Behind Forecast Complexity
Hurricane behavior is shaped by a cascade of interconnected variables. The spaghetti model accounts for these layers: ocean heat content, which fuels intensity; steering winds in the upper troposphere, which guide motion; and mid-level moisture and wind shear, which can suppress or enhance development. Small errors in initial measurements—such as a 0.5°C temperature variation at 850 hPa—can amplify over days, causing forecast divergence.This sensitivity is known as chaotic behavior intrinsic to nonlinear systems like the atmosphere, famously described by Edward Lorenz’s “butterfly effect.” The spaghetti model embraces this chaos, offering not a single prediction but a spectrum of possibilities that empower decision-makers.
Each line on the spaghetti chart is a data-rich narrative. Meteorologists analyze spacing, curvature, and proximity to major landmasses.
For example, when all tracks cluster within a 50-mile band north of Hispaniola or the Bahamas, emergency planners recognize high likelihood of impact, enabling targeted evacuation orders. But when lines fan out across Florida’s peninsula—diverging by hundreds of miles—the message shifts: uncertainty dominates, necessitating flexible response strategies.
historically, this model transformed hurricane forecasting from guesswork to precision. Before widespread supercomputing, forecasts relied on statistical models or analog sketches—static maps based on past storm patterns.
Even today, spaghetti outputs remain vital. When Hurricane Ian struck Florida in 2022, for instance, the Monte Carlo ensemble run showed 23 out of 45 model iterations project landfall within a narrow corridor, anchoring federal and state evacuation orders with unprecedented confidence.
Interpreting the Tangled Lines: Expert Insights
Meteorologist Dr. Maria Alvarez, a tropical cyclone specialist at NOAA’s National Hurricane Center, explains: “The spaghetti model isn’t meant to confuse—it clarifies the range of credible outcomes.” Her team evaluates not just proximity to land, but also timing, intensity shifts, and potential rapid intensification zones.“A line that sacrifices central track accuracy for reliable intensity estimates might suggest danger even if the center doesn’t cyber directly over Florida,” she notes. By visually comparing divergence, forecasters identify consensus tracks while flagging outlier scenarios that demand closer scrutiny.
Decision-makers, from FEMA directors to broadcast meteorologists, depend on these visualizations to balance urgency with accuracy. When multiple tracks converge on a single region—say, the Gulf Coast during early September—the model validates heightened readiness without over-forecasting.
But when paths fan widely, it warns of evolving threats requiring continuous monitoring and agile response plans.
The spaghetti model’s structure also reveals subtle shifts in storm dynamics. A sudden looping or sharp turn in multiple lines may signal an approaching trough or a developing changement in steering currents.
Such patterns, invisible in single-track forecasts, offer early clues about storm evolution. In 2017, Hurricane Harvey’s erratic loop near Texas appeared clearly in ensemble data, allowing authorities to extend flood warnings well beyond initial projections.
Evolving Tools, Enduring Value
As computing power grows, so does the resolution and number of model runs in spaghetti-based forecasts. Modern systems generate 100+ tracks at 12-hour intervals, downlinking real-time updates that refine predictions hourly.Machine learning now helps filter signal from noise, highlighting the most credible ranges while suppressing outliers. Yet the core principle remains: visualizing uncertainty through interwoven trajectories. This approach does more than inform—it transforms raw data into strategic clarity, guiding residents, agencies, and emergency response systems through the razor’s edge between calm and crisis.
Other forecasting paradigms offer trails, but none capture complexity with such visceral transparency. The spaghetti model endures not just as a technical tool, but as a bridge between chaos and control. It reminds us that hurricanes, born of turbulence, obey patterns hidden within complexity—patterns best seen not in isolation, but woven together in the intricate tapestry of ensemble forecasts.
As coastal communities brace against an era of more intense storms fueled by climate change, this tangled map of possibilities remains indispensable in shaping timely, life-saving decisions.


Related Post

Angel Falls Soars: Canaima National Park’s Crown Jewel Revealed

The Transformative Vision of Judith Ligh: Redefining Leadership and Innovation

What Happened to Angela Moody from Sister Wives? The Shocking Fall from Faith to Family Drama

Do Kryptonian Powers Actually Exist on Krypton? The Science Behind Superman’s Superhuman Abilities