Master Probability with Cards: The Class 10 Made Easy Guide That Transforms Your Understanding
Master Probability with Cards: The Class 10 Made Easy Guide That Transforms Your Understanding
Probability is the language of randomness—whether in games of chance, data analysis, or real-world decision-making. For Class 10 students navigating the statistics chapter, mastering probability concepts can feel daunting. But with the discreet power of a Cards Probability Chart, learners gain a clear, visual roadmap to probability rules, outcomes, and calculations.
This guide unpacks how the Cards Probability Chart becomes an indispensable tool, using real examples and structured learning to demystify homework and exams.
The Cards Probability Chart is not merely a visual aid; it is a cognitive shortcut that converts abstract chance into tangible, structured data. At its core, probability quantifies the likelihood of events occurring, measured as the ratio of favorable outcomes over total possible outcomes.
For instance, drawing an ace from a standard 52-card deck has a probability of 4 out of 52, or approximately 7.7%. Yet, this simplicity unfolds into complexity when multiple cards or events are involved—contexts where the Chart reveals patterns invisible to mere formulaic practice.
Decoding the Cards Probability Chart: Design and Functionality
The Cards Probability Chart is a tabular or flow-style diagram designed to map scenarios involving card draws, shuffled outcomes, and conditional events. It organizes the elementary components of probability—sample space, favorable outcomes, and total possibilities—into a user-friendly format.Each row typically represents a distinct event or draw, while columns define constraints like suit, rank, and joint probabilities. Key elements include:
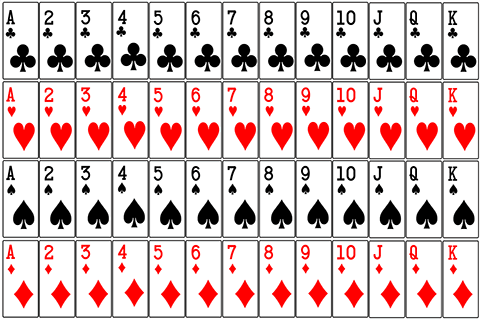
Sample Space: The complete set of possible outcomes. For one card draw from a full deck: {Ace of Spades, 3 of Hearts, ..., King of Diamonds}, totaling 52 items.
Favorable Outcomes: Specific events of interest—such as drawing a face card or a card of hearts.
Calculated as favorable ÷ sample space, this ratio defines individual event likelihoods.
Total Outcomes: All possible results under defined conditions. In multi-draw scenarios, combinations matter—order may or may not matter depending on context.
This structure enables students to visualize not just probabilities, but the logic behind them: Why drawing a red card is 26 out of 52 (50% chance), and why drawing a king after an ace changes the probability?
Core Probability Rules Grounded in Card Examples
The Cards Probability Chart elucidates foundational probability principles with precision. Four major rules form the backbone of the framework:1.
Basic Probability Formula; P(E) = F / T, where P(E) is the probability of event E, F is the count of favorable outcomes, and T is the total outcomes.
Example: What’s the chance of drawing an ace? With 4 aces and 52 cards, P(ace) = 4/52 = 1/13 ≈ 7.7%.
2. Addition Rule – Or Conditions; Used when events are mutually exclusive (cannot happen together).
Example: Probability of drawing an ace or a king.
Since these are disjoint, P(ace ∪ king) = P(ace) + P(king) = 4/52 + 4/52 = 8/52 ≈ 15.38%.
3. Multiplication Rule – Independent Events; When the outcome of one event does not affect another.
Example: Drawing two cards without replacement. First draw ace (4/52), second draw king from remaining 51 cards (4/51).
Combined: (4/52) × (4/51) ≈ 0.0059 or 0.59%.
4. Conditional Probability: Probability of an event given prior knowledge.
Suppose a card drawn is known to be a spade—probability of it being a heart now drops to 0. Since 13 spades exist and hearts and spades are disjoint, P(heart | spade) = 0.
These rules, when grasped through structured charts and card-based practice, empower students to analyze increasingly complex probability problems with confidence.
Visualizing Outcomes: How the Chart Boosts Learning and Retention
A well-designed Cards Probability Chart transforms abstract numbers into a spatial narrative.Students track favorable outcomes using color coding, shaded cells, or shaded regions, reinforcing memory and pattern recognition. For instance, a chart showing all 13 hearts in a deck—each with equal chance—helps visual learners internalize the symmetry and uniformity of chance.
Visual reinforcement aids cognitive retention: studies show learners retain data better when concepts are paired with imagery.
Each row in the Chart maps a potential outcome, while shaded diagonals or sections highlight cumulative probabilities. This visual scaffolding supports deeper understanding beyond rote memorization.
Moreover, the Chart encourages active engagement. As students populate rows by enumerating cards or arranging combinations, they internalize process over formula.
They discover how changing conditions—like removing a card—resets the sample space and shifts probabilities instantly, illustrating real-time dynamics of randomness.
Real-World Applications Beyond the Classroom
Card probability isn’t just an academic exercise—it mirrors situations encountered outside school. Understanding conditional probability, for example, improves analysis in fields like insurance, medical testing, and market research. Apps and games train decision-making using card-like randomness, reinforcing pattern recognition skills.Medical professionals use similar logic when evaluating test accuracy—calculating false positives and positives based on base rates, much like assessing red vs. black outcomes. Engineers depend on probability models for risk assessment in construction and finance.
A solid grasp of basics, such as those practiced through the Cards Probability Chart, lays the foundation for these complex applications.
Step-by-Step Problem Solving with the Chart Using the Cards Probability Chart, students master structured problem-solving frameworks:
**Step 1: Define the Experiment** — Clarify the action (drawing a card, rolling two dice).
**Step 2: Identify Outcomes** — List all possible results. For one deck, 52 cards; for two cards, 52 × 51 combinations without replacement.
**Step 3: Count Favorables and Total** — Use chart columns for favorable vs. total.
**Step 4: Apply Rule** — Choose formula based on event type: addition, multiplication, or conditional.
**Step 5: Simplify & Interpret** — Reduce fractions and explain results contextually.
Compared to generic problem sets, this method reduces errors and builds analytical confidence—critical when exams demand both speed and accuracy.
Practical Tips for Effective Use in Exam Prep To maximize the benefit of the Cards Probability Chart from “Made Easy,” students should integrate it strategically into study routines:
- **Practice Daily:** Use short, timed drills focusing on specific rules to embed memory.
- **Compare with Others:** Contrast probability of drawing hearts in one draw versus two draws, noting how sample space changes.
- **Visualize Probabilities:** Shade cells for favorable outcomes to strengthen spatial memory.
- **Simulate Real Scenarios:** Turn cards into coins, dice, or everyday objects (e.g., choosing a fruit from a basket) to reinforce generalizability.
Teachers note that regular, guided use of the Chart correlates with improved test scores and deeper conceptual clarity, making it a preferred tool in modern statistics pedagogy.
The Cards Probability Chart is more than a memorization aid; it is a cognitive tool that shapes how learners perceive and engage with chance.
It transforms abstract numbers into tangible, manageable pieces, revealing patterns hidden within randomness. For Class 10 students grappling with probability


Related Post

Matt Czuchry’s Love Life Revealed: All You Need to Know About His Wife and the Secret Behind Their Union

Is Patrick Mahomes’ Daughter Special Needs? A Detailed, Compassionate Look

Tragic Loss: Johnny Crawford, Icon of ‘The Rifleman,’ Dies at 75

Lagrange’s Daily Pulse: Police Updates and Obituaries Reflect Community’s Heartbeat


